Note
Go to the end to download the full example code.
Handling Grid-based Forecasts
This example show you how to load a gridded forecast stored in the default ASCII format.
Load required libraries
Most of the core functionality can be imported from the top-level csep package. Utilities are available from the
csep.utils subpackage.
import csep
from csep.utils import datasets, time_utils
Define forecast properties
We choose a Time-independent Forecast to show how to evaluate a grid-based earthquake forecast using PyCSEP. Note, the start and end date should be chosen based on the creation of the forecast. This is important for time-independent forecasts because they can be rescaled to any arbitrary time period.
start_date = time_utils.strptime_to_utc_datetime('2006-11-12 00:00:00.0')
end_date = time_utils.strptime_to_utc_datetime('2011-11-12 00:00:00.0')
Load forecast
For this example, we provide the example forecast data set along with the main repository. The filepath is relative to the root directory of the package. You can specify any file location for your forecasts.
forecast = csep.load_gridded_forecast(datasets.helmstetter_mainshock_fname,
                                      start_date=start_date,
                                      end_date=end_date,
                                      name='helmstetter_mainshock')
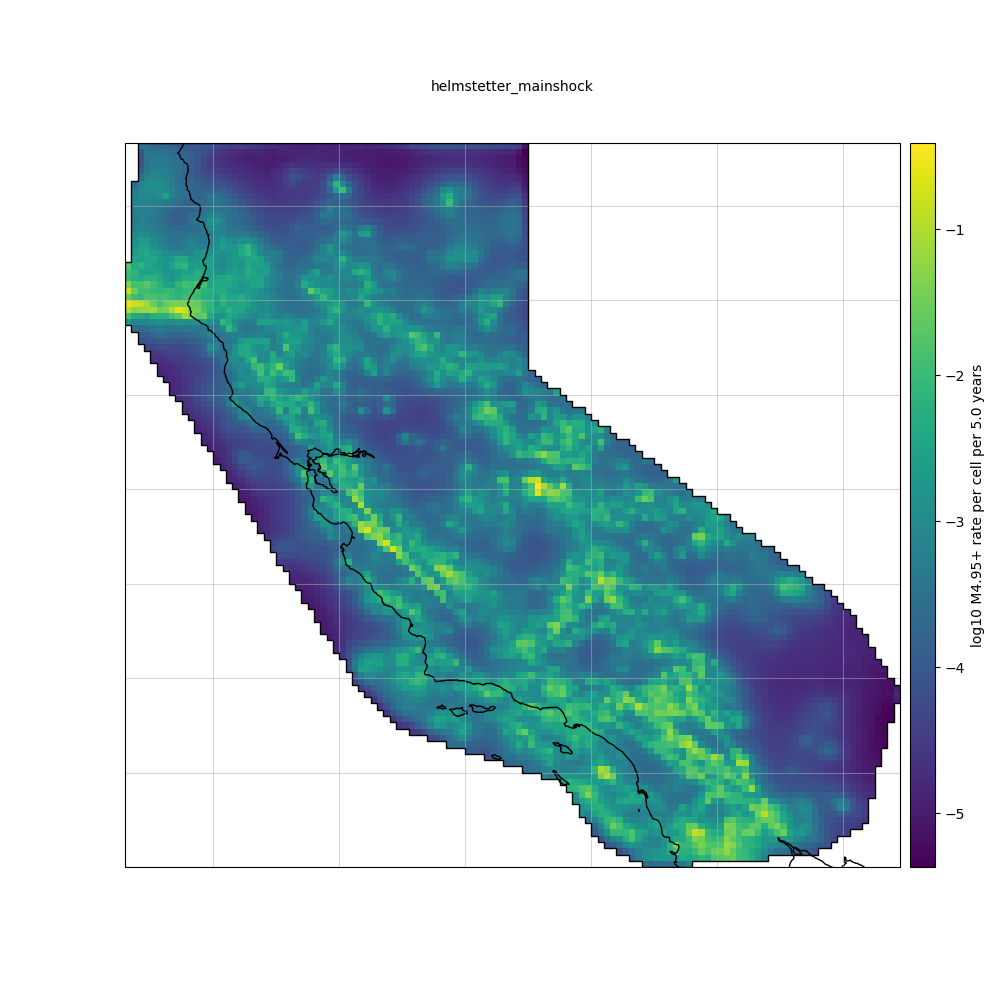
Plot forecast
The forecast object provides a plot() method to plot its data spatially. This function
returns a matplotlib axes, so more specific attributes can be set on the figure (See Plot customizations and plot_gridded_dataset() for more information).
ax = forecast.plot(show=True)
Cleaning existing basemap cache
Total running time of the script: (0 minutes 2.478 seconds)