Note
Go to the end to download the full example code.
Catalog-based Forecast Evaluation
This example shows how to evaluate a catalog-based forecasting using the Number test. This test is the simplest of the evaluations.
- Overview:
Define forecast properties (time horizon, spatial region, etc).
Access catalog from ComCat
Filter catalog to be consistent with the forecast properties
Apply catalog-based number test to catalog
Visualize results for catalog-based forecast
Load required libraries
Most of the core functionality can be imported from the top-level csep package. Utilities are available from the
csep.utils subpackage.
import csep
from csep.core import regions, catalog_evaluations
from csep.utils import datasets, time_utils
from csep import plots
Define start and end times of forecast
Forecasts should define a time horizon in which they are valid. The choice is flexible for catalog-based forecasts, because the catalogs can be filtered to accommodate multiple end-times. Conceptually, these should be separate forecasts.
start_time = time_utils.strptime_to_utc_datetime("1992-06-28 11:57:35.0")
end_time = time_utils.strptime_to_utc_datetime("1992-07-28 11:57:35.0")
Define spatial and magnitude regions
Before we can compute the bin-wise rates we need to define a spatial region and a set of magnitude bin edges. The magnitude
bin edges # are the lower bound (inclusive) except for the last bin, which is treated as extending to infinity. We can
bind these # to the forecast object. This can also be done by passing them as keyword arguments
into csep.load_catalog_forecast().
# Magnitude bins properties
min_mw = 4.95
max_mw = 8.95
dmw = 0.1

# Create space and magnitude regions. The forecast is already filtered in space and magnitude
magnitudes = regions.magnitude_bins(min_mw, max_mw, dmw)
region = regions.california_relm_region()

# Bind region information to the forecast (this will be used for binning of the catalogs)
space_magnitude_region = regions.create_space_magnitude_region(region, magnitudes)
Load catalog forecast
To reduce the file size of this example, we’ve already filtered the catalogs to the appropriate magnitudes and spatial locations. The original forecast was computed for 1 year following the start date, so we still need to filter the catalog in time. We can do this by passing a list of filtering arguments to the forecast or updating the class.
By default, the forecast loads catalogs on-demand, so the filters are applied as the catalog loads. On-demand means that until we loop over the forecast in some capacity, none of the catalogs are actually loaded.
More fine-grain control and optimizations can be achieved by creating a csep.core.forecasts.CatalogForecast directly.
forecast = csep.load_catalog_forecast(datasets.ucerf3_ascii_format_landers_fname,
                                      start_time=start_time, end_time=end_time,
                                      region=space_magnitude_region,
                                      apply_filters=True)

# Assign filters to forecast
forecast.filters = [f'origin_time >= {forecast.start_epoch}',
                    f'origin_time < {forecast.end_epoch}']
Obtain evaluation catalog from ComCat
The csep.core.forecasts.CatalogForecast provides a method to compute the expected number of events in spatial cells. This
requires a region with magnitude information.
We need to filter the ComCat catalog to be consistent with the forecast. This can be done either through the ComCat API or using catalog filtering strings. Here we’ll use the ComCat API to make the data access quicker for this example. We still need to filter the observed catalog in space though.
# Obtain Comcat catalog and filter to region.
comcat_catalog = csep.query_comcat(start_time, end_time, min_magnitude=forecast.min_magnitude)

# Filter observed catalog using the same region as the forecast
comcat_catalog = comcat_catalog.filter_spatial(forecast.region)
print(comcat_catalog)

# Plot the catalog
comcat_catalog.plot(show=True)
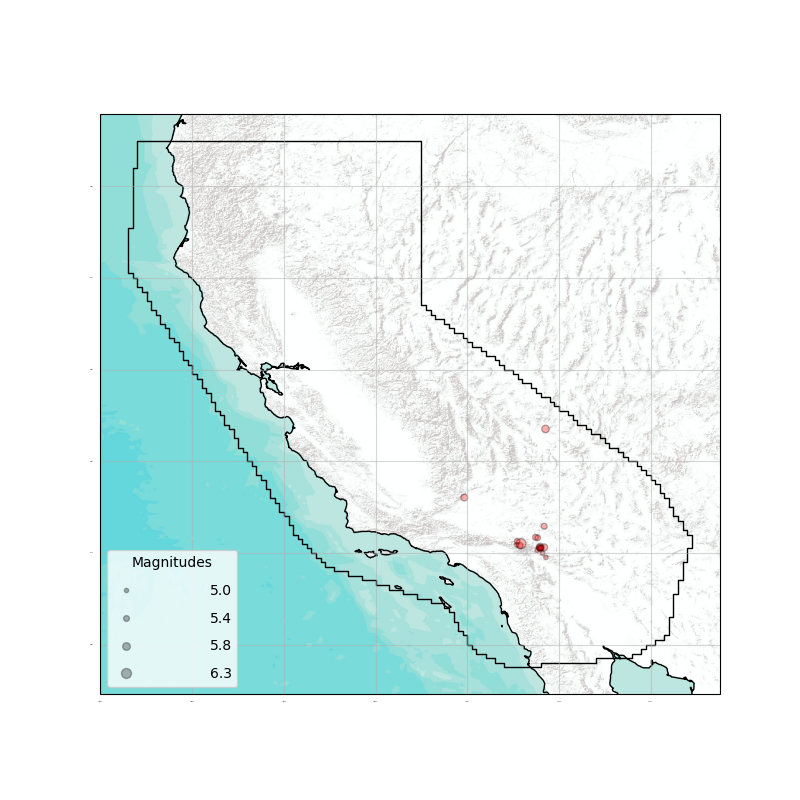
Fetched ComCat catalog in 0.37638020515441895 seconds.

Downloaded catalog from ComCat with following parameters
Start Date: 1992-06-28 12:00:45+00:00
End Date: 1992-07-24 18:14:36.250000+00:00
Min Latitude: 33.901 and Max Latitude: 36.705
Min Longitude: -118.067 and Max Longitude: -116.285
Min Magnitude: 4.95
Found 19 events in the ComCat catalog.

        Name: None

        Start Date: 1992-06-28 12:00:45+00:00
        End Date: 1992-07-24 18:14:36.250000+00:00

        Latitude: (33.901, 36.705)
        Longitude: (-118.067, -116.285)

        Min Mw: 4.95
        Max Mw: 6.3

        Event Count: 19


<GeoAxes: >
Exploratory visualizations
We can visualize differences between the distribution of event counts of the observations against the forecast:
plots.plot_cumulative_events_versus_time(forecast, comcat_catalog, time_axis='days', show=True)
<Axes: xlabel='Days after Mainshock', ylabel='Cumulative event counts'>
and their magnitude histograms
plots.plot_magnitude_histogram(forecast, comcat_catalog, log_scale=False, show=True)
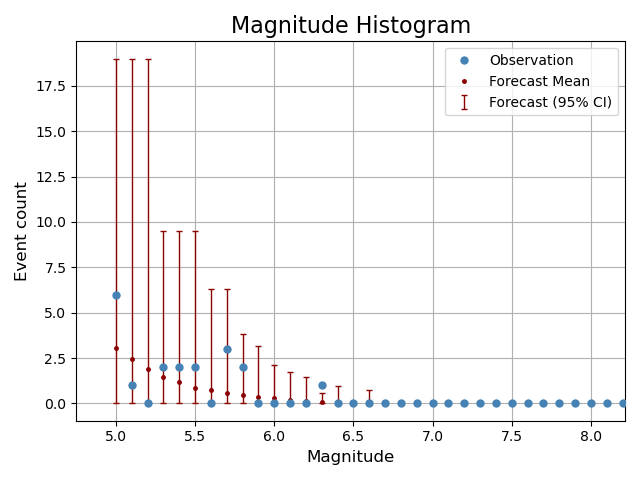
<Axes: title={'center': 'Magnitude Histogram'}, xlabel='Magnitude', ylabel='Event count'>
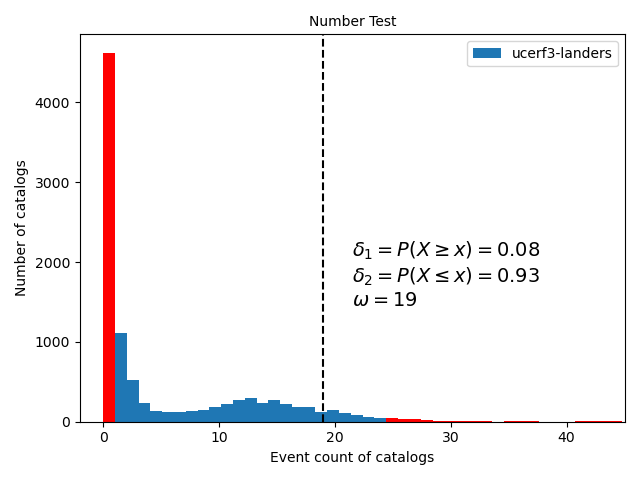
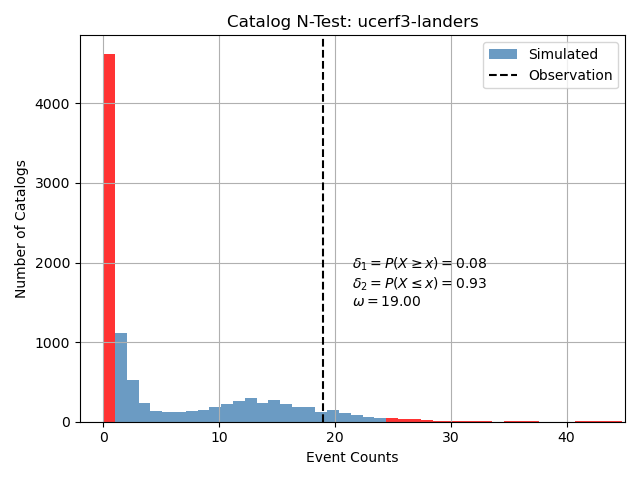
Perform number test
We can perform the Number test on the catalog based forecast using the observed catalog we obtained from Comcat.
number_test_result = catalog_evaluations.number_test(forecast, comcat_catalog)
Plot number test result
We can create a simple visualization of the number test from the evaluation result class.
ax = number_test_result.plot(show=True)
Total running time of the script: (0 minutes 8.116 seconds)